
If you're a data scientist, ML engineer, technical leader, or product manager working with machine learning models in production, this post is for you. Understanding model monitoring can make the difference between AI systems that you trust, and models silently making bad predictions that erode business value without anyone knowing. Even if you're not technical, this will help you understand what to ask for and why it matters. In this post, I'll discuss:
- Why ML-monitoring matters in real business terms
- The three pillars of ML-monitoring and how to choose the right strategy
- Some ideas in how to design dashboards that actually get used
- An example of a scalable monitoring architecture for multiple models
A Dashboard That Caught a Fraud Attack
Let’s start with a real story. Not long ago, one of our data scientists was reviewing the new monitoring dashboard of a real-time fraud detection model. Everything looked normal, except for a small, sharp peak in the distribution of prediction scores.
Curious, he decided to dig deeper. The spike wasn’t random. After a quick investigation with the business team, it turned out to be a fraud attempt in progress, a coordinated pattern the model had never seen before.
Thanks to that visibility, the team acted fast and prevented what could have been a significant financial loss.
That single incident proved that:
Model monitoring can become as essential as training
The Hidden Challenge of “Successful” Models
The story began earlier this year with a realization we had while collaborating with one of our clients: many of their production models were technically sound, and well-validated, yet, once deployed, their real-world behavior was mostly invisible.
It wasn’t negligence. In fact, it’s a common pattern in mature ML teams: a strong focus on training performance, but fewer tools to observe how those same models behave months later, under shifting data and conditions.
Because the problem was present in more than twenty models, we decided to build a shared monitoring framework, a lightweight system that could give every model a voice.
After several months building the framework together, all the models began reporting their metrics automatically. Each one started building a living history of its performance, the foundation for trust, iteration, and, as we soon discovered, profit enhancement.
The Core Principle: Sleep Peacefully Knowing Your AI Works for You
A well-trained model can perform brilliantly on day one. But over time, the world moves: customers behave differently, data sources evolve, and subtle biases creep in.
Monitoring ensures your AI evolves with reality. It’s the practice that lets you sleep at night, knowing that if something shifts, you’ll know before it becomes a problem.
The Foundation: Build an Ecosystem That Listens
Monitoring isn't about tracking everything, it's about tracking what matters, when it matters. The three fundamental pillars of machine learning monitoring each offer different perspectives on model health, and understanding their characteristics helps teams build monitoring systems tailored to their specific needs and constraints.
These pillars exist on a spectrum of diagnostic capability. Some metrics provide early warnings that demand investigation. Others offer definitive proof that justifies immediate action. Between speed and certainty lies the core of effective monitoring.
To Consider ⚠️
Before diving into each pillar, understand this: input and output drift monitoring, without proper calibration, can generate endless false alarms, notifications about "drift" that don't actually indicate real problems. Developers start ignoring alerts. The monitoring system becomes noise rather than signal. This is why these metrics require careful tuning and patience during implementation. Expect to invest 3-6 weeks of calibration time per model, reviewing alerts, correlating them with actual performance issues, and adjusting thresholds.
Input Drift: The Earliest Warning Signal
Input drift occurs when the features entering your model no longer resemble the data it was trained on. This divergence can stem from seasonal patterns, market shifts, upstream data pipeline changes, or evolving user behavior. For example, a customer propensity model trained on pre-pandemic travel data might suddenly receive bookings with patterns it has never encountered, longer advance purchases, flexible dates, and different demographics. The features have drifted even though the model code remains unchanged.
The Urgency-Confidence Tradeoff
Input drift provides high urgency detection but demands careful interpretation. It alerts you the moment something changes in your data landscape, requiring no ground truth or outcome validation. This immediacy makes it invaluable for proactive monitoring, you can identify potential issues before they manifest as degraded predictions or business losses.
However, this speed comes at the cost of confidence. Not all drift signals genuine problems. Seasonal variations, legitimate market evolution, or planned business changes can all trigger drift alerts without actually harming model performance. A retail model that flags drift during the holiday shopping season may simply be observing expected behavior rather than a failure mode.
The challenge intensifies with dimensionality. Models with hundreds of features generate numerous drift signals, making it difficult to distinguish meaningful shifts from statistical noise. Early in your monitoring journey, teams must invest time in understanding which features matter most and which drift patterns historically correlate with performance degradation.
Building Confidence Through Calibration
The path to reliable input drift monitoring involves experimentation and calibration. When implementing drift detection, teams should begin with conservative thresholds and gradually refine them based on observed outcomes. Each drift alert becomes a learning opportunity, did this signal precede actual performance issues, or was it a false alarm?
This calibration period is essential. Data scientists and domain experts should manually investigate drift alerts, examining the business context and checking whether predictions remain accurate despite the distributional shift. Over time, patterns emerge. Certain features prove more sensitive than others. Specific types of drift consistently predict problems while others prove benign.
The goal is not to eliminate false positives entirely but to understand your baseline noise level and tune thresholds accordingly.
Strategic Application
Input drift monitoring proves most valuable when ground truth feedback arrives slowly or when the cost of degraded performance is high. Credit risk models, insurance underwriting systems, and long-term customer lifetime value predictions all benefit from early drift detection because correcting course after waiting for outcomes means months of suboptimal decisions have already been made.
In adversarial environments like fraud detection, input drift can signal emerging attack patterns before they succeed at scale. Attackers constantly probe model boundaries, and their reconnaissance activities often appear as subtle shifts in feature distributions. Catching these signals early provides a tactical advantage.
Output Drift: Behavioral Changes in Model Predictions
Output drift tracks changes in the distribution of model predictions themselves, independent of input behavior. This metric answers a deceptively simple question: is my model behaving differently than before? When a binary fraud classifier historically flags eight percent of transactions but suddenly drops to two percent or spikes to fifteen percent, output drift captures this shift even if input features appear stable.
Unlike input drift, output drift monitors a single distribution rather than hundreds of features, making it more interpretable. The business relevance is also more direct, changes in prediction patterns immediately affect downstream decisions, whether those involve approval rates, recommendation volumes, or resource allocation.
The Urgency-Confidence Tradeoff
Like input drift, output drift offers high urgency detection with limited diagnostic confidence. It requires no ground truth and can alert teams within hours or days of a behavioral change. For businesses where prediction volume or approval rates directly impact revenue, this immediacy matters tremendously.
However, output drift suffers from similar ambiguity. A shift in predictions could indicate numerous underlying causes: genuine input drift that propagated through the model, numerical instability in production code, data leakage, infrastructure changes, or emerging correlations the model was never designed to handle. The metric confirms something changed but provides little insight into the root cause or whether intervention is necessary.
The calibration challenge mirrors that of input drift. Early implementations generate alerts that require investigation to determine their significance. Was that spike in high-confidence fraud predictions legitimate, perhaps you launched a new product that attracts riskier customers, or does it signal a model malfunction? Only retrospective analysis paired with ground truth can answer definitively.
Building Confidence Through Context
Effective output drift monitoring requires rich contextual information. Teams should track not just whether predictions shifted but also correlate these changes with known events, model deployments, data pipeline updates, marketing campaigns, seasonal patterns, or infrastructure modifications. Annotating drift timelines with this context helps distinguish expected variation from genuine anomalies.
The calibration period again proves essential. Teams must invest time understanding their model's normal behavioral range. What constitutes an acceptable prediction distribution shift? How much week-to-week variation is typical? These questions lack universal answers and depend on your specific model, domain, and business dynamics.
Over time, teams develop intuition about which output patterns merit immediate investigation versus which represent acceptable variation. This organizational learning transforms output drift from a noisy alert stream into a valuable behavioral monitoring tool.
Strategic Application
Output drift monitoring excels when prediction changes have immediate business consequences and when you need signals that non-technical stakeholders can readily understand. Recommendation systems, dynamic pricing models, and approval-rate-sensitive applications all benefit from tracking prediction distributions because these directly tie to observable business metrics.
The simplicity of monitoring a single distribution also makes output drift attractive for initial monitoring implementations. Teams can establish baseline tracking quickly, then layer additional sophistication as they gain confidence in their monitoring infrastructure.
Model Drift: Ground Truth Validation
Model drift measures actual predictive performance degradation over time by comparing predictions against real-world outcomes. This represents the gold standard of monitoring, not inference or correlation, but direct measurement of whether your model continues fulfilling its purpose.
When ground truth arrives, you can calculate precision, recall, F1 scores, and other performance metrics just as you did during training and validation. The difference is that production monitoring tracks these metrics continuously, revealing gradual erosion that might otherwise go unnoticed until a business-impacting failure occurs.
The Urgency-Confidence Tradeoff
Model drift inverts the tradeoff we've seen with input and output monitoring. It provides the highest confidence at the cost of reduced urgency. When precision drops from eighty-five percent to seventy percent according to ground truth evaluation, there is no ambiguity, your model's performance has genuinely degraded. This clarity makes model drift the definitive signal for retraining decisions and the most compelling metric for stakeholder communication.
The limitation is timing. Ground truth requires that outcomes have actually occurred and been captured. For some applications, this feedback arrives within hours, a recommendation system learns whether users clicked within the session. For others, outcomes take weeks or months to materialize. Credit default predictions, customer churn models, and long-term forecasting systems all suffer from delayed feedback loops.
This lag means that by the time model drift confirms a problem, you have already made days, weeks, or months of suboptimal predictions. The damage has occurred; you are simply measuring its extent. This reactive nature makes model drift insufficient as a sole monitoring strategy for high-stakes applications.
Strategic Application
Despite its delayed nature, model drift remains indispensable. It provides the ground truth necessary to validate whether other monitoring signals actually mattered. Did that input drift alert predict genuine problems, or was it noise? Model drift answers definitively.
It also serves as the ultimate justification for resource-intensive interventions like model retraining. When stakeholders question whether retraining is necessary, model drift metrics provide compelling evidence. Showing a clear downward trend in precision or F1 score makes the case far more effectively than statistical tests on feature distributions.
For applications with rapid feedback loops, model drift can even serve as the primary monitoring signal. Real-time bidding systems, session-based recommendations, and operational forecasting models often receive ground truth quickly enough that waiting for it remains practical. In these cases, the high confidence of model drift outweighs its modest delay.
Designing a Monitoring Strategy: Layering Signals for Optimal Detection
No single drift metric provides complete visibility into model health. The most effective monitoring systems layer multiple signals, each optimized for different scenarios and decision points. Understanding how to combine these metrics transforms monitoring from a collection of alerts into a coherent early warning system.
The Time-Layered Approach
Consider how the three drift types work together across a timeline. In the first week after a significant environmental change, input drift may trigger an alert. Feature distributions have shifted, but predictions still appear normal and ground truth has not yet arrived. At this stage, the team begins investigating, checking for upstream data issues, reviewing recent business changes, and examining whether the drift affects critical features or peripheral ones.
By the second week, output drift confirms that prediction patterns have indeed changed. The model is behaving differently, not just receiving different inputs. This elevates urgency. While still lacking ground truth confirmation, the combination of input and output drift suggests a genuine shift rather than measurement noise.
Three to four weeks later, ground truth begins arriving. Model drift metrics confirm what the earlier signals suggested: performance has degraded. Precision has dropped. The alerts were valid. This validation enables confident action, scheduling retraining, adjusting business processes, or implementing temporary overrides.
This layered progression allows teams to escalate their response appropriately. Early signals prompt investigation and heightened attention. Combined signals justify preparing remediation plans. Ground truth confirmation triggers execution.
Choosing Your Monitoring Priority
Different business contexts demand different monitoring emphasis. High-stakes applications with slow feedback loops, credit risk assessment, insurance underwriting, customer lifetime value prediction, should prioritize input and output drift despite their ambiguity. Waiting months for ground truth before detecting problems is unacceptable when each bad prediction carries significant cost.
Adversarial environments like fraud detection and spam filtering benefit from monitoring all three layers comprehensively. Attackers adapt continuously, and the combination of early warnings plus validation enables rapid response cycles. Input drift catches emerging attack patterns, output drift confirms they affect predictions, and model drift validates the business impact.
Recommendation systems and content ranking applications occupy a middle ground. They generate high prediction volumes with relatively fast feedback loops, hours or days rather than months. Here, output drift provides valuable operational visibility while model drift offers reliable performance tracking without excessive delay.
Operational efficiency applications like demand forecasting and logistics optimization often receive ground truth daily. For these systems, model drift can serve as the primary monitoring signal, with input and output drift playing supporting diagnostic roles when performance issues arise.
Monitoring Strategy Reference: Choosing Your Approach
Different business contexts demand different combinations of monitoring pillars. The table below summarizes common monitoring strategies, their appropriate use cases, and the rationale behind each approach. Use this as a starting point for designing your own monitoring system based on your specific constraints and priorities.
| Strategy | Pillars Used | Best For | Example Use Case | Why This Combination Works |
|---|---|---|---|---|
| Early Warning System | Input Drift + Output Drift | High-stakes decisions with slow feedback loops | Credit risk assessment, insurance underwriting, long-term customer value prediction | Detects issues before ground truth arrives. Months-long feedback delays make waiting for model drift unacceptable. Combined signals (input + output) reduce false positives. |
| Adversarial Defense | All Three (Input + Output + Model) | Environments with active adversaries | Fraud detection, spam filtering, bot detection, content moderation | Attackers continuously adapt. Input drift catches reconnaissance, output drift confirms attack success, model drift validates business impact. Comprehensive coverage essential. |
| Performance-First | Model Drift (primary) + Output Drift (diagnostic) | Applications with rapid ground truth feedback | Real-time recommendations, session-based personalization, same-day operational forecasting | Ground truth arrives within hours or days. High-confidence model drift justifies waiting. Output drift helps diagnose issues when they occur. |
| Operational Monitoring | Output Drift + Model Drift | Business-critical prediction volumes | Dynamic pricing, inventory optimization, demand forecasting | Prediction distribution changes directly impact operations. Model drift provides validation when outcomes arrive daily or weekly. |
| Compliance & Audit | Model Drift + Prediction Logging | Regulated industries requiring explainability | Healthcare diagnostics, financial services, lending decisions | Regulators demand proof of sustained performance, not drift speculation. Complete prediction logs enable retrospective audits and bias analysis. |
| Lightweight Baseline | Output Drift only | Resource-constrained teams or low-risk models | Internal tools, experimental features, non-critical recommendations | Simplest to implement and maintain. Monitors behavioral changes without complex infrastructure. Suitable when consequences of drift are limited. |
| Research-Oriented | Input Drift (primary) + Model Drift (validation) | Models in domains with shifting distributions | Market prediction, trend forecasting, emerging behavior detection | Understanding environmental changes is as important as performance. Input drift reveals what's changing in the world; model drift confirms impact. |
How to Use This Table
Start by identifying your primary constraint: Is ground truth slow or fast? Are the stakes high or moderate? Do you face adversaries? Then select the strategy that best matches your situation. Remember that these are starting points, not rigid prescriptions. Many production systems evolve from simpler strategies to more comprehensive ones as they mature and as teams gain calibration experience.
The most common evolution path begins with output drift monitoring for simplicity, adds model drift once ground truth pipelines are established, and finally layers input drift when teams have developed the expertise to interpret and act on early warning signals effectively.
Design Meaningful Dashboards
A well-crafted dashboard doesn't just display data, it guides decisions, surfaces problems, and bridges the gap between technical metrics and business impact. Make sure your dashboard does not end in the pile of forgotten Dashboards.
Start with Business Impact, Not Technical Metrics
The most common mistake in ML monitoring is creating dashboards that only data scientists can understand. Drift scores, KL divergence values, and distribution plots matter technically, but they don't answer the questions that keep business stakeholders awake at night: "Are we losing money? Are customers getting worse recommendations? Is fraud getting through?"
Build dashboards with your business partners, not for them. Before designing a single visualization, sit down with the people who depend on your model's output. Ask them what decisions they make based on model behavior. Understand their pain points. Learn which metrics they already track manually.
For a fraud detection model, this might mean correlating input drift alerts with the dollar value of flagged transactions. For a recommendation system, it could involve connecting output drift to click-through rates and revenue per user. The goal is to create dashboards where technical metrics stand alongside, or even drive, business KPIs.
This alignment serves two critical purposes. First, it makes monitoring actionable. When drift appears next to a revenue drop, intervention becomes obvious. Second, it builds organizational trust. When business teams see monitoring as their tool rather than a technical curiosity, they become advocates for maintaining and improving the system.
The Non-Negotiable: Ground Truth Performance Over Time
Every meaningful dashboard must include one foundational element: actual model performance measured against real outcomes over time. This is your north star. Without it, you're navigating by indirect signals alone.
Design your dashboard to accommodate delayed feedback explicitly. Show the most recent ground truth performance prominently, even if it's from two weeks ago. Display a trend line extending back months or longer. When the business questions whether monitoring investments are worthwhile, this graph provides the answer, either showing stable performance that justifies confidence or revealing degradation that demands action.
The presence of ground truth metrics also validates your entire monitoring strategy. When input drift spikes correlate with subsequent performance drops, you've proven those early warning signals matter. When drift alerts fire but performance remains stable, you've learned to calibrate your thresholds differently. Ground truth closes the feedback loop that transforms monitoring from guesswork into a precision instrument.
Dashboard Design Principles That Drive Action
With business alignment and ground truth as your foundation, consider these practical design principles drawn from real production monitoring systems:
Hierarchy of urgency: Place the most actionable metrics at the top. Current drift scores, recent performance trends, and active alerts deserve immediate visibility. Historical context and detailed distributions belong below, accessible but not dominating attention.
Time contextualization: Always include timestamps for training, last backtesting, and recent evaluations. Teams need to know whether they're looking at yesterday's metrics or data from three weeks ago. Stale dashboards erode trust faster than no dashboard at all.
Signal-to-noise optimization: Resist the temptation to show everything you can measure. A dashboard cluttered with dozens of feature-level drift scores overwhelms users and obscures critical issues. Start minimal, drift summaries, key business metrics, and ground truth performance, then add complexity only where it proves valuable through usage.
Comparative context: Show not just current values but meaningful comparisons. Drift scores mean little in isolation; display them against baseline training distributions. Performance metrics gain meaning when plotted as trends rather than single points. Business metrics become actionable when shown alongside historical norms or targets.
Investigation pathways: Good dashboards make digging deeper intuitive. If drift appears high, provide a link to feature-level details. If performance drops, enable filtering by customer segment or transaction type. The dashboard should guide investigation, not terminate it with summary statistics.
A Reference Implementation
The dashboard shown below monitored a real-time prediction model serving production traffic. While several proprietary business metrics have been omitted for privacy, the structure illustrates the principles we've discussed.
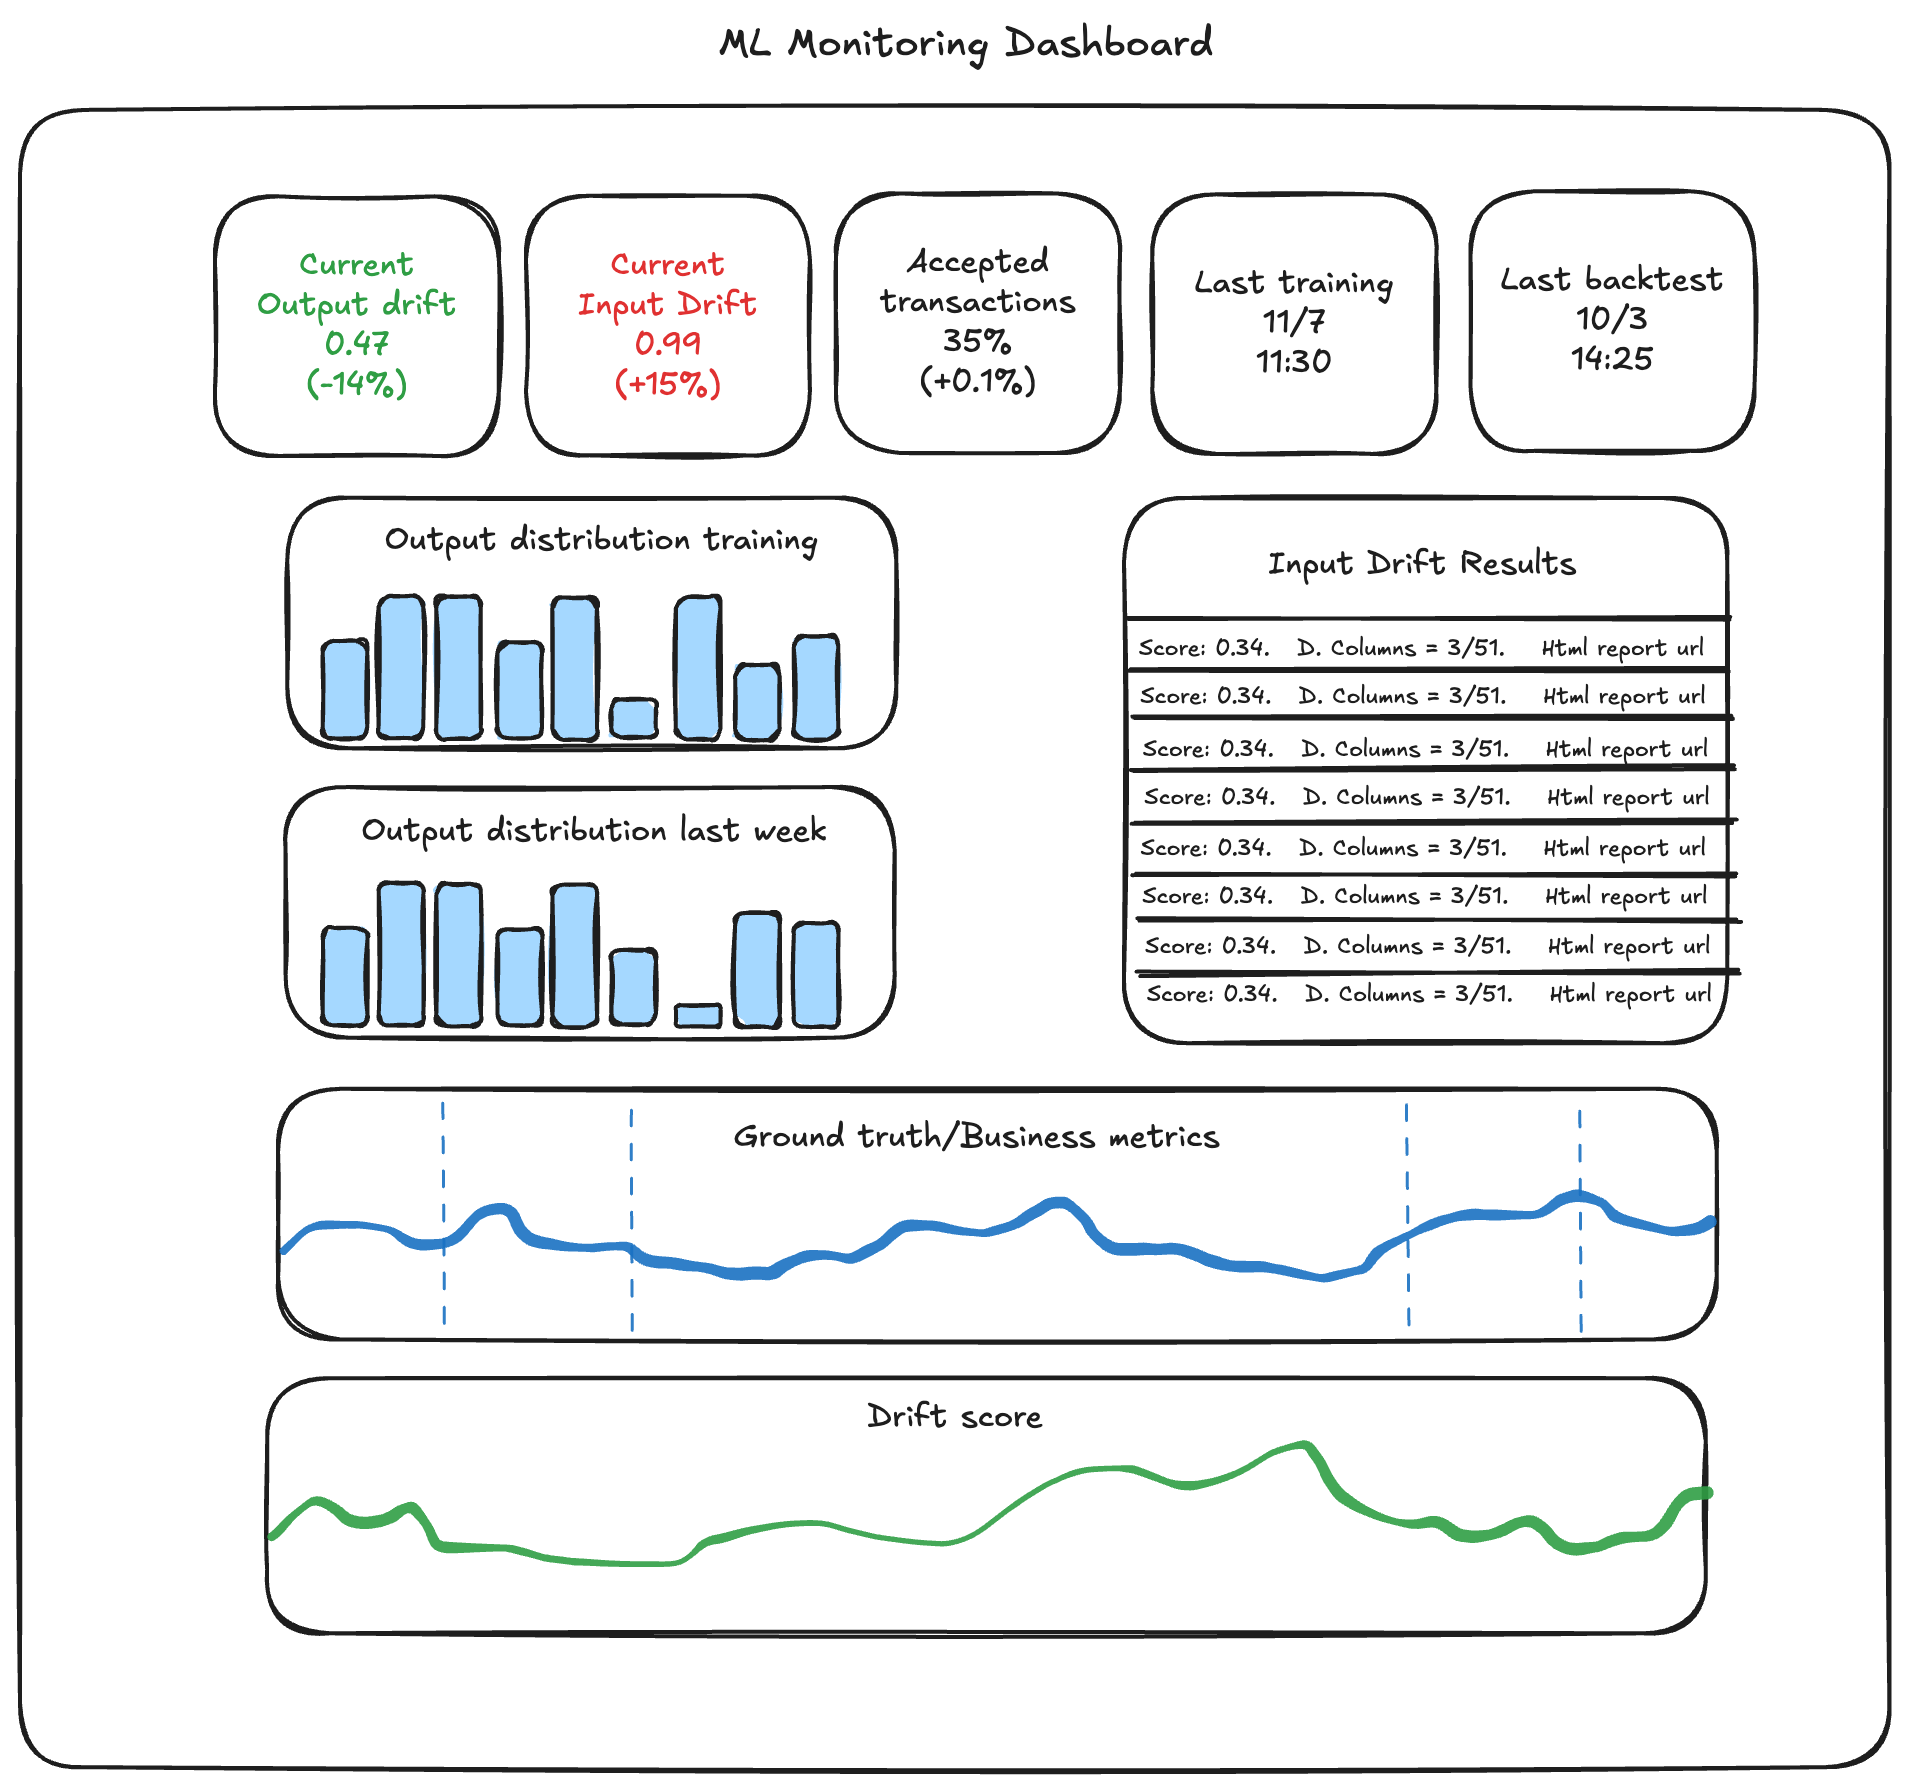
Notice the information architecture:
- Top row metrics: Critical summary statistics including current drift levels (with percentage changes), transaction acceptance rates, and timing information. These answer at a glance: "Is something wrong right now?"
- Distribution panels: Visual comparison of output distributions between training and recent production data, plus a historical week-over-week view. These enable pattern recognition, is this drift anomalous or seasonal?
- Input drift detail: A table showing specific features that drifted significantly, complete with scores and links to detailed reports. This provides an investigation starting point when drift alerts fire.
- Business metrics integration: The ground truth/business metrics panel correlates model behavior with actual outcomes over time. Vertical dashed lines mark model deployments or significant events, making causality visible.
- Overall drift score trend: The bottom panel tracks comprehensive drift metrics over time, showing whether model-data alignment is improving, degrading, or stable.
This dashboard balances immediate actionability with investigative depth. Business stakeholders can assess model health in seconds. Data scientists can dive into feature-level details in two clicks. Everyone shares a common view of model behavior tied to real-world impact.
Measuring Drift with Evidently
Evidently is an open-source Python library that helps implement testing and monitoring for production machine learning models [1], making it straightforward to quantify how far your production data has drifted from your training baseline. You can calculate several types of metrics:
Feature Drift , Statistical tests like the Kolmogorov-Smirnov test or Jensen-Shannon divergence can be used to detect distribution changes in individual features [3, 4]. For smaller datasets with fewer than 1,000 observations, Evidently uses the two-sample Kolmogorov-Smirnov test for numerical features and the chi-squared test for categorical features [1]. For larger datasets with more than 1,000 observations, it uses Wasserstein Distance for numerical features and Jensen-Shannon divergence for categorical features [1].
Prediction Drift , This monitors shifts in model predictions, comparing class distributions for classification tasks or regression outputs, helping to detect when the model's performance starts diverging [1].
Target Drift , Once labels are available, target drift tracking detects changes in real outcomes, which can indicate changes in user behavior or system issues [1].
Minimal Example
Here's a simple implementation:
from evidently.report import Report
from evidently.metric_preset import DataDriftPreset
report = Report(metrics=[DataDriftPreset()])
report.run(reference_data=train_df, current_data=prod_df)
report.save_html("data_drift_report.html")
This generates a self-contained HTML dashboard with interactive visualizations [1, 2] showing:
- Distribution overlaps between training and production data
- Statistical significance indicators , p-values showing which features have significantly shifted, with all tests using a 0.95 confidence level by default [1]
- Summary metrics , Overall drift percentage, with dataset drift detected by default when at least 50% of features drift at the 0.95 confidence level [1]
Scaling Monitoring Across Multiple ML Models (in GCP)
When your organization has dozens of models, manual dashboards quickly become unmanageable. Instead, you can standardize metric ingestion and visualization through a shared monitoring pipeline:
1. Shared Python Base Class
Create a shared base class (e.g., BaseMonitoredModel) that all production ML models inherit from. This class defines common methods for logging metrics, tracking model versions, and emitting structured logs.
class BaseMonitoredModel:
    def __init__(self, model_name):
        self.model_name = model_name

    def log_metrics(self, metrics: dict):
        # logs metrics to Cloud Logging under a standard format
        client = google.cloud.logging.Client()
        logger = client.logger("ml_metrics")
        logger.log_struct({
            "model_name": self.model_name,
            **metrics
        })
Cloud Logging supports structured logs that use the jsonPayload field to add structure to their payloads, making log entries queryable and analyzable MediumGoogle Cloud [5, 6].
2. Standard Logging Function
Each model, whether for recommendations, forecasting, or classification, just calls:
self.log_metrics({"accuracy": 0.91, "drift_score": 0.12, "latency_ms": 45})
This enforces a uniform structure across all models' metrics. A consistent structure enables powerful features like request tracing and source code linking automatically Waltlabs [7].
3. Transversal Metrics Collector
A background Cloud Function or Dataflow job can periodically query Cloud Logging, extract metrics following the shared schema, and write them into BigQuery Medium Medium [8, 9]. This becomes your unified metrics warehouse, independent of each team's implementation details.
4. Grafana Dashboard from BigQuery
Grafana can ingest data directly from BigQuery using the Google BigQuery data source plugin, which allows you to query and visualize BigQuery data within Grafana dashboards Grafana Grafana [10, 11]. Each dashboard auto-generates panels per model name, showing:
- Model performance trends (accuracy, drift, latency)
- Recent alerts
- Comparison between model versions
The BigQuery plugin for Grafana provides real-time visualization, flexible dashboards, and powerful monitoring features, making it easier to gain insights from complex data Hevo Google Cloud [12, 13].
This pipeline lets teams monitor ML systems in a standardized, low-code, and scalable way , perfect for organizations with many production models. For smaller setups (1–2 models), a lightweight solution like Evidently's standalone reports might be sufficient.
Closing the Loop
When these elements come together, contextual storage, continuous logging, automated drift detection, and unified dashboards, your models become observable systems, not black boxes. Instead of discovering problems after incidents, you gain early warnings and clear visibility into how your AI behaves in the real world.
The Payoff: Profitable, Predictable, and Peaceful ML
After implementing this monitoring framework, our client’s models became not just more transparent, but more valuable. Teams could detect issues early, retrain with confidence, and understand performance in business terms, not just technical metrics.
And in one key case, it helped protect and validate real money.
If your models are already in production, ask yourself:
“Would I know if one of them started drifting today?”
If the answer is uncertain, it might be time to let your models start talking.
References
- Evidently AI Documentation - Data Drift Guide https://www.evidentlyai.com/ml-in-production/data-drift
- Evidently GitHub Repository https://github.com/evidentlyai/evidently
- NannyML Documentation - A Comprehensive Guide to Univariate Drift Detection Methods https://www.nannyml.com/blog/comprehensive-guide-univariate-methods
- Evidently AI Blog - Which test is the best? We compared 5 methods to detect data drift on large datasets https://www.evidentlyai.com/blog/data-drift-detection-large-datasets
- Google Cloud Documentation - Structured Logging https://cloud.google.com/logging/docs/structured-logging
- Medium - Structured Logging in Google Cloud https://medium.com/google-cloud/structured-logging-in-google-cloud-61ee08898888
- WaltLabs Blog - From Chaos to Clarity: Structured Logging on GCP https://www.waltlabs.io/blog/structured-logging-in-python-on-gcp
- Medium - End-to-End Machine Learning on Google Cloud with Dataflow and BigQuery https://datascienceafrica.medium.com/end-to-end-machine-learning-on-google-cloud-with-dataflow-and-bigquery-using-open-data-0216a90d400a
- Medium - Airflow, BigQuery, Dataflow, Cloud Run, and Workflows, Building Data Platform on GCP https://medium.com/@mariusz_kujawski/airflow-bigquery-data-flow-cloud-run-and-workflows-building-data-platform-on-gcp-250373889312
- Grafana Labs - Google BigQuery Plugin Documentation https://grafana.com/grafana/plugins/grafana-bigquery-datasource/
- Grafana Labs Blog - Visualize Google Cloud BigQuery Data in Grafana https://grafana.com/blog/2025/06/18/visualize-google-cloud-bigquery-data-in-grafana-the-latest-updates-key-features-and-more/
- Google Cloud Blog - Data Visualizations Easier with Grafana Plugin for BigQuery https://cloud.google.com/blog/products/data-analytics/grafana-and-bigquery-together-at-last
- Hevo Data - Grafana BigQuery Integration https://hevodata.com/learn/grafana-bigquery/


