
As we all have heard, artificial intelligence is transforming the way organizations process and leverage their data. One of its most promising applications is computer vision, which enables the conversion of unstructured information—particurarly images or videos—into structured, actionable data to optimize critical processes.
A recurring challenge in sectors like logistics and parcel delivery is the mishandling of shipments. Impacts, drops, or incorrect handling can damage products, leading to customer dissatisfaction, financial compensation, and even legal claims.
In this article, we explore how object detection and action recognition techniques can be applied to monitor baggage operations in the aviation industry. We cover the full process: from training a model to generating real-time detections and identifying actions that impact service quality.
YOLO – from Classification to Object Detection
YOLO (You Only Look Once) is a computer vision algorithm designed for real-time object detection. Unlike traditional approaches that analyze an image region by region, YOLO divides the image into a grid and predicts, in a single pass, the presence of objects, their location through bounding boxes, and their corresponding class. This architecture makes it extremely fast and efficient, even in video.
While other object detection architectures such as Faster R-CNN, SSD, and RetinaNet have also achieved remarkable results, YOLO stands out for its balance between speed and accuracy, making it one of the most widely adopted models.
Although there are technical aspects such as non-maximum suppression to avoid duplicate boxes or the use of anchor boxes to handle multiple objects in the same region, the goal of this article is not to delve into YOLO’s internal workings. If you’d like to explore these concepts in more detail, I recommend checking out this resource: What is YOLO algorithm? . Instead, this article focuses on how YOLO can be applied to practical industry cases, where its speed and accuracy enable monitoring processes and generating useful operational insights.
Training the Object Detection Model
The first step in a computer vision system is to train an object detection model, such as YOLO, which uses convolutional neural networks (CNNs) to identify and locate elements in images or video.
This requires a labeled dataset, with images and annotation files indicating the position and class of objects, organized into training and validation folders, along with a configuration file (YAML) that defines the classes. Tools like LabelImg and Roboflow LabelImg and Roboflow facilitate the creation, management, and cleaning of these labels, optimizing the pre-training workflow.
In this project, transfer learning from a pretrained model is used to identify suitcases, which significantly reduces the amount of labeled data required—around 1,500 images are sufficient. Without a pretrained model, tens of thousands of labeled images would likely be necessary to achieve proper performance.
Training Dataset
To train an object detection model, a labeled dataset is required, consisting of images and their corresponding annotation files. The images are usually in standard formats like JPG or PNG, while each label is a text file (.txt) sharing the same name as its image, which allows for direct association.
Each line in a label file corresponds to a single object in the image and specifies the class ID, along with the bounding box’s center coordinates (x and y), width, and height.
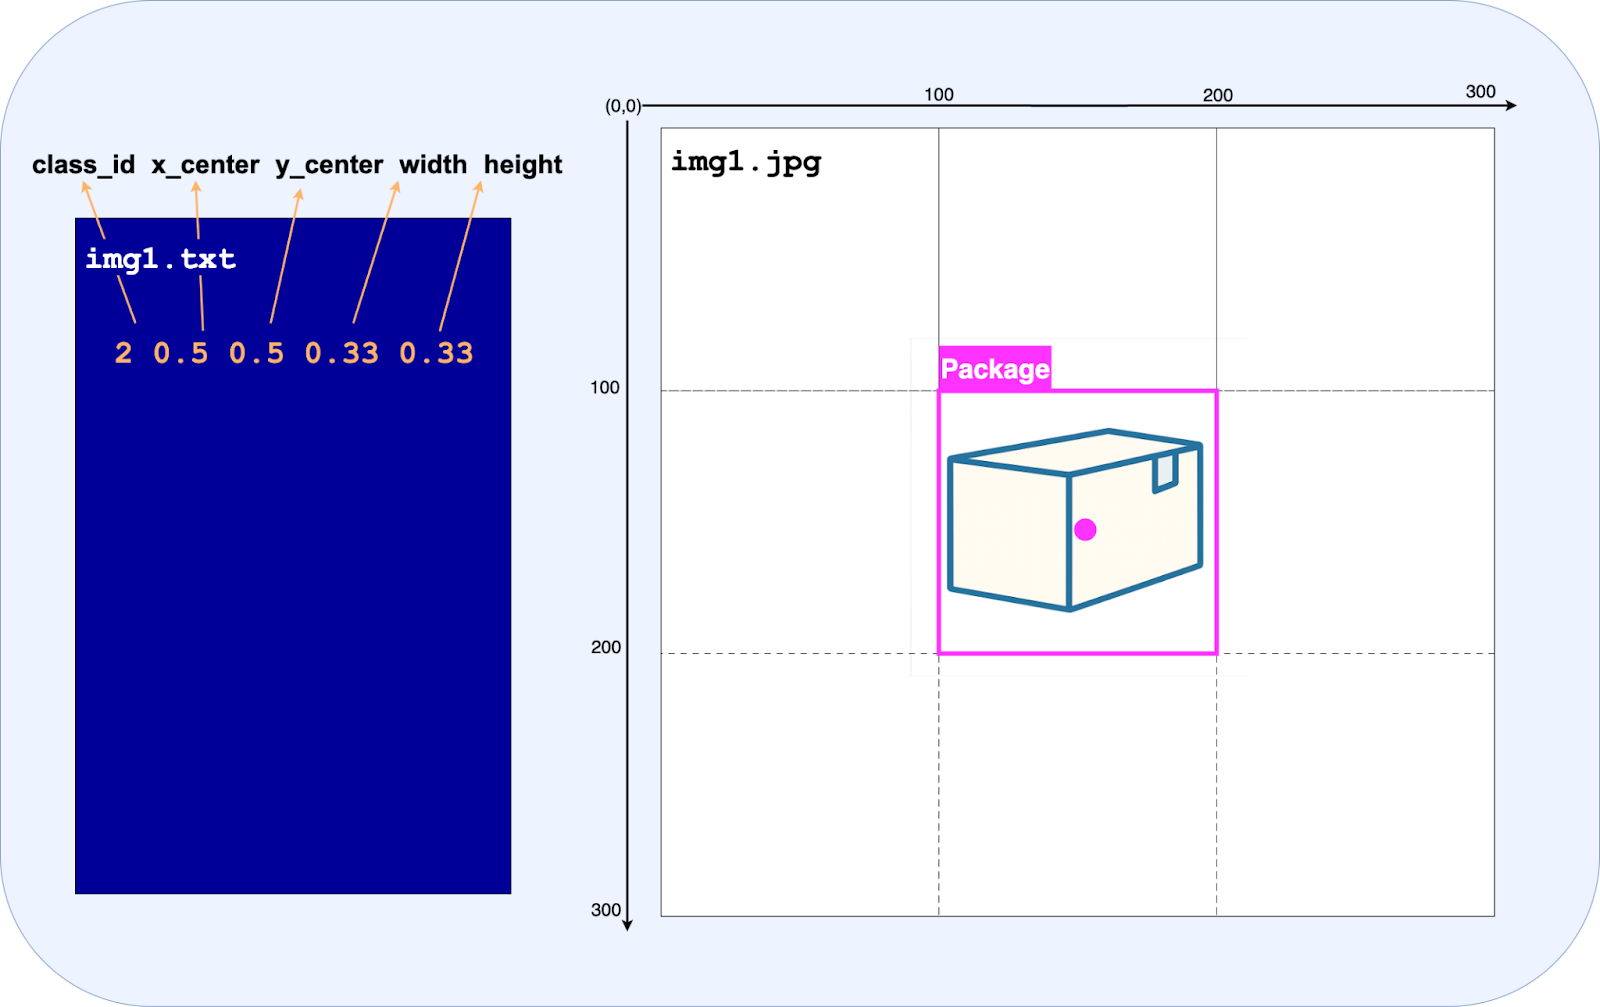
Here, class_id indicates the object’s category—in this case, class 2 corresponds to packages. The x_center and y_center values represent the normalized coordinates of the bounding box center relative to the image dimensions, placing the box roughly at 50% of the image width and 50% of the height. The width and height are also normalized, meaning the bounding box spans about 33% of the width and 33% of the height of the image.
This labeling format ensures that the model can learn both the location and size of objects consistently, regardless of the original image resolution, providing a solid foundation for accurate object detection.
Before starting training, it is also necessary to create a YAML file that describes the dataset structure.
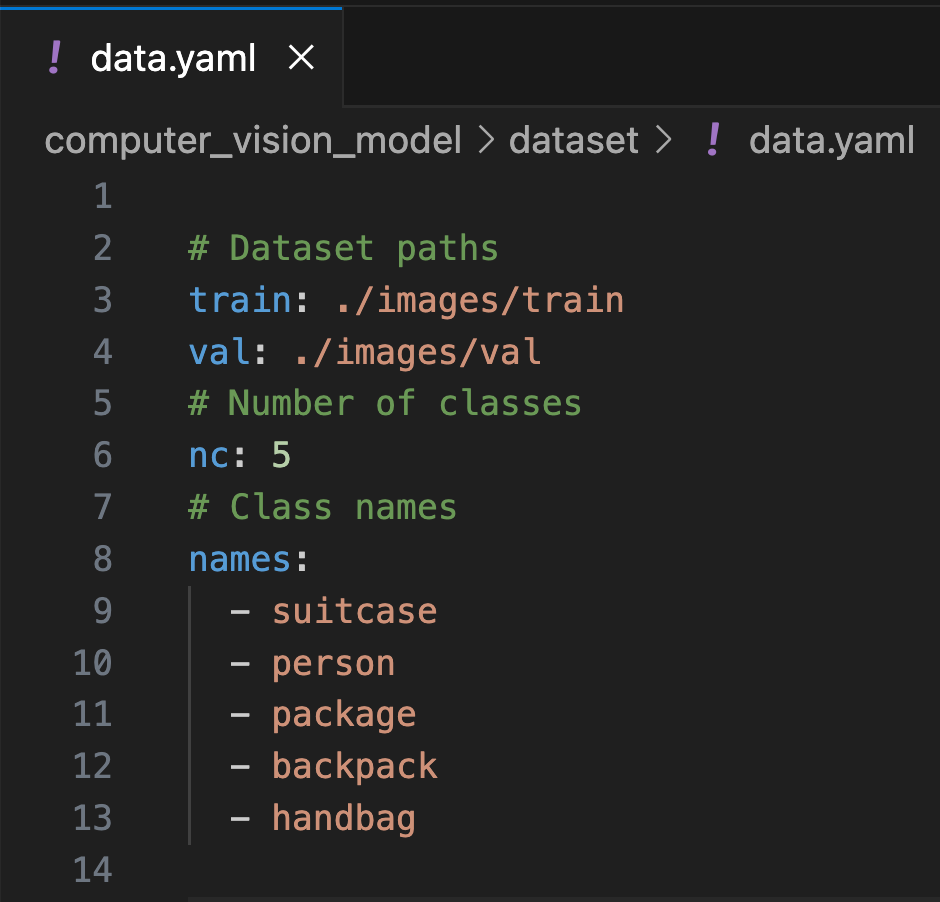
This file should include:
- Paths to the training and validation data.
- The total number of classes.
- The list of classes with their corresponding names.
Training process
YOLO uses convolutional neural networks (CNNs), so during training it is necessary to adjust various hyperparameters, such as the number of epochs, batch size, learning rate, optimizer, and others. These parameters determine how the network learns and help optimize both convergence and model accuracy.
Additionally, YOLO supports transfer learning through the use of pre-trained models on large datasets, such as COCO. In this approach, it is possible to freeze certain layers of the network that have already learned general image representations, allowing training to focus on the upper layers and adapt the model to the new task. This accelerates training and improves generalization, especially when the available data is limited.
For training, the YOLO model from Ultralytics was used, which allows full control over the hyperparameters, providing a flexible and high-level framework for configuring and optimizing the model.
Training Output
At the end of training, YOLO generates several essential files for making predictions and evaluating the model.
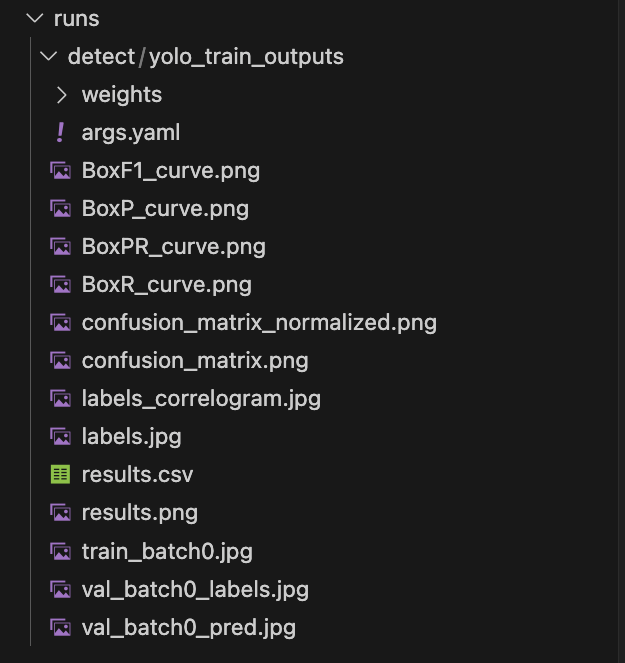
- best.pt: contains the weights of the model that achieved the best performance during training and will be used for predictions.
- Intermediate weights and checkpoints: allow training to be resumed or to review progress from previous epochs.
- Performance evaluation files: include metrics such as loss, precision, recall, and mAP (mean Average Precision) for each class, which help analyze how the model has learned and identify potential areas for improvement.
These files provide both a model ready for inference and the necessary information to monitor and validate its performance before deploying it in production.
Predictions
The workflow for predictions is organized into multiple stages, including object detection, operator pose estimation, object tracking, and depth determination. This structure provides sufficient information to later perform action recognition. The following sections provide a closer look at each of these stages.
Object Detection
As a result of predictions using YOLO, we obtain arrays containing information about the bounding box positions and sizes, the object classes, and the confidence scores for each class. It is important to understand that the data obtained from detections are essentially coordinates in a Cartesian system, which allow us to identify the position of an object within an image. YOLO uses the following coordinate system:
· Origin (0,0): top-left corner of the image
· x-axis: increases toward the right
· y-axis: increases downward
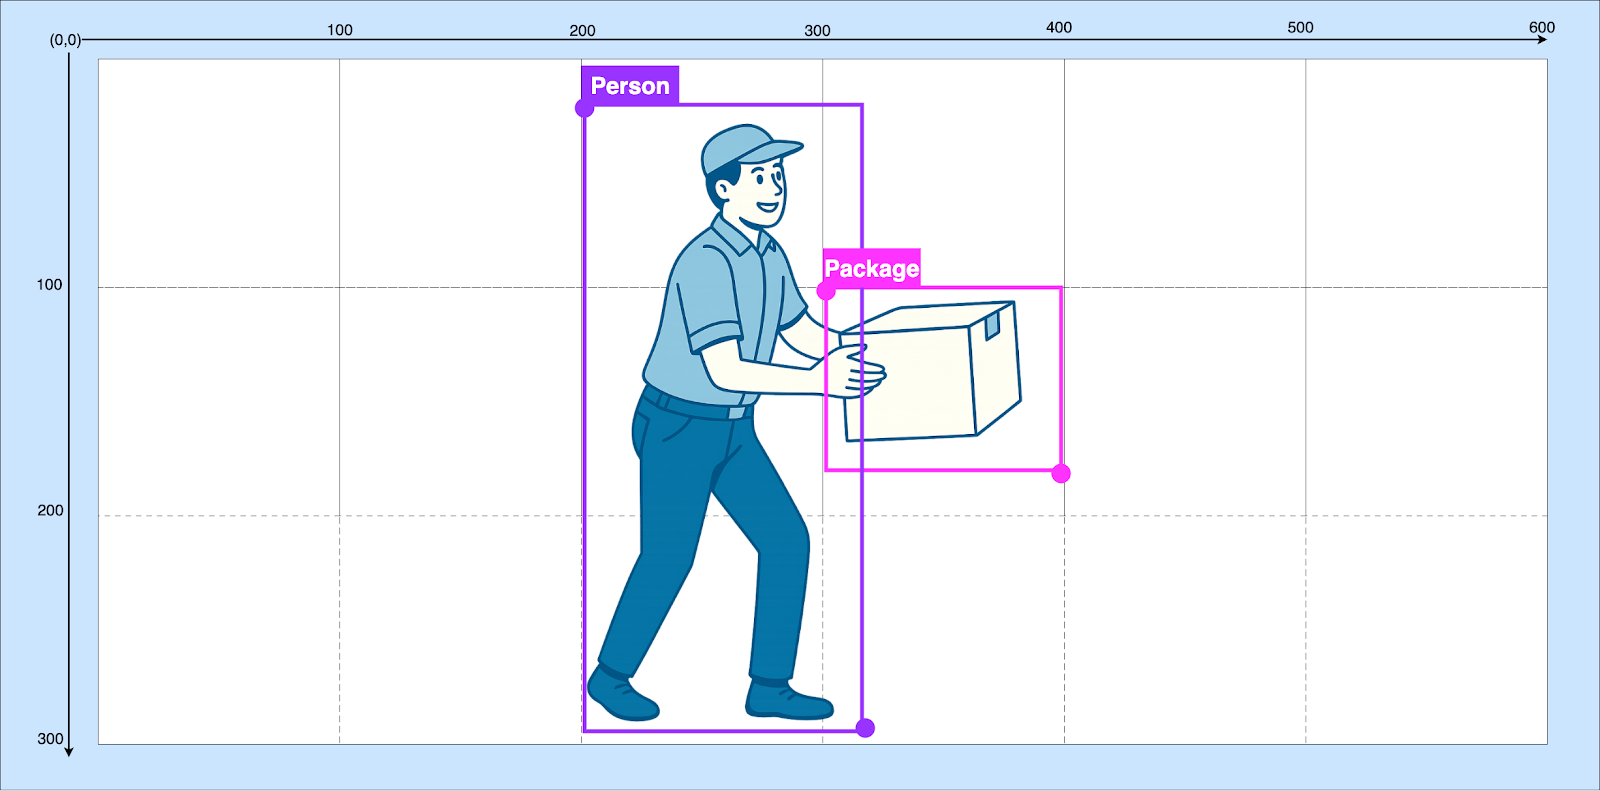
For example, if we are detecting two classes—persons and packages—assigned class 1 and 2 respectively. When reviewing the results, we get an array with the bounding box positions, class, and classification confidence. Example YOLO detection output:
| Boxes | cls | conf |
|---|---|---|
| [300, 100, 400, 180] | 2 | 0.91 |
| [300, 100, 400, 180] | 1 | 0.87 |
- Bounding box coordinates: represent the pixel positions of the top-left and bottom-right corners of the boxes.
o x1 → left (top-left corner X coordinate)
o y1 → top (top-left corner Y coordinate)
o x2 → right (bottom-right corner X coordinate)
o y2 → bottom (bottom-right corner Y coordinate)
In the example, for the first detection [300, 100, 400, 180], the top-left corner of the box is at pixel (300, 100) and the bottom-right corner at (400, 180).
· Class index: numerical assignment of the class corresponding to the detected object. In this case, the detected classes are 2 and 1, corresponding to a package and a person, respectively.
· Confidence: the confidence score of the detection. Here, the package has a confidence of 0.91 and the person 0.87. The closer this value is to 1, the more certain we are of the detection.
Pose Estimation
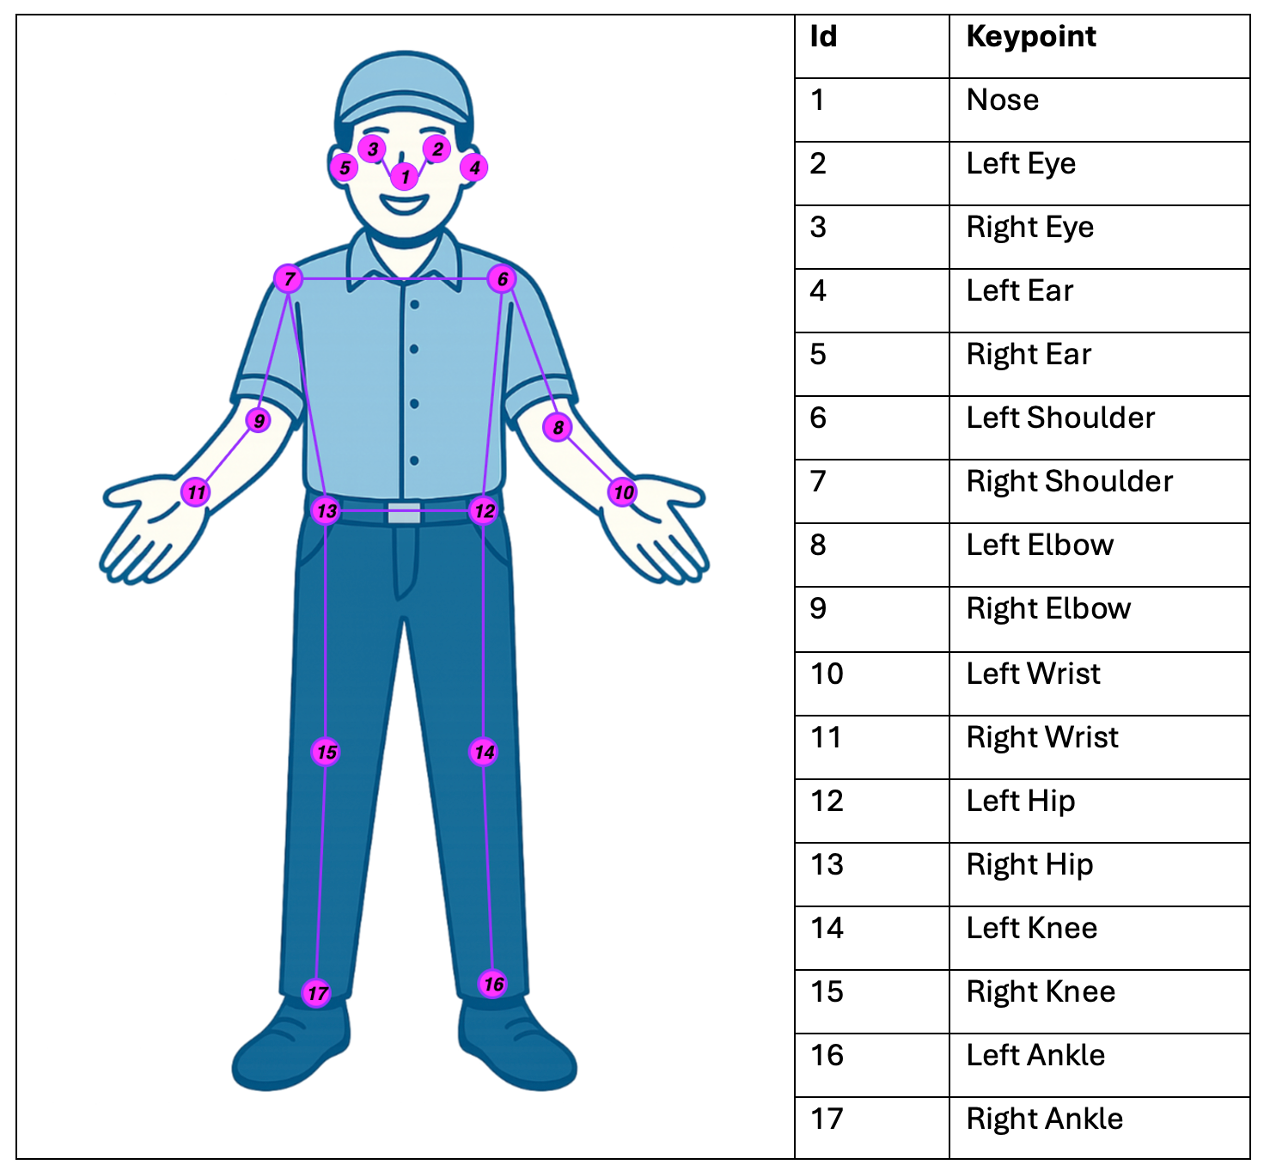
Later, when performing action recognition, it is important to understand how people interact with the detected objects—for example, knowing when an operator places their hands on an object indicates manipulation—so the next step in our computer vision model focuses on human pose estimation, which identifies the keypoints of the operators’ joints.
Various pre-trained models are available for this task, differing mainly in the number and granularity of keypoints they can detect. In our case, we use YOLO Pose for its balance between accuracy and computational efficiency.
The inference output is a structured tensor that contains, for each person detected in the image, the pixel coordinates (x, y) of 17 keypoints, along with the confidence score associated with each detection. Analogous to object detection, the relevant output can be represented as a set of coordinate vectors enriched with probability measures.
Object Tracking in Videos
Object tracking in video sequences ensures that each detection in a frame can be correctly associated with the same entity in subsequent frames. This process allows building continuous and reliable trajectories, which are essential for analyzing multiple moving objects.
To achieve this, tracking algorithms are required to maintain detection continuity over time. In our case, we use the ByteTrack library, one of the most widely used trackers, as it converts frame-by-frame detections into stable trajectories, enabling precise and robust tracking in dynamic environments.
The process works as follows:
1. Object detection: A detection model (e.g., YOLO) identifies objects and draws bounding boxes on each frame.
2. ID assignment: ByteTrack compares detections between consecutive frames. To determine if it is the same object, it primarily considers:
3. Position and size of the boxes: how close the boxes are between frames.
4. IOU (Intersection over Union): measures how much two boxes overlap.
5. Matching association: Using this information, ByteTrack applies an assignment algorithm to pair new detections with already tracked objects. If the match is strong enough, the same unique ID is maintained for that object.
6. Handling low-confidence detections: Unlike other trackers, ByteTrack also leverages low-confidence detections, which prevents losing track when an object is partially occluded or poorly detected in a frame.
7. Result: Each detected object retains a consistent ID throughout the video, allowing us to know, for example, that the object with ID 5 in frame 1 is the same as the object with ID 5 in frame 50.
Each tracked object includes multiple attributes, with the key ones being:
· track_id: unique ID assigned by the tracker (used to maintain object identity across frames).
· tlbr (top, left, bottom, right): bounding box in [x1, y1, x2, y2] format (top-left, bottom-right), following the same logic as YOLO.
· score: confidence score of the associated detection.
Depth Estimation
When working with video sequences, depth estimation becomes essential to represent the position of objects in a three-dimensional space. In computer vision, much of the challenge lies in modeling the geometric structure of the scene, and incorporating depth information allows for more accurate spatial relationships.
Depth can be estimated using multi-view or stereo systems, where epipolar geometry and triangulation are used to reconstruct metric distances.
In our case, working with a monocular system (single-camera system for scene analysis), direct recovery of absolute depth is not possible. Therefore, we use MiDaS, a model designed to predict relative depth maps from single images, allowing us to capture the scene’s geometry even without stereo information.
The depth_map generated by MiDaS is a two-dimensional matrix (commonly represented as a NumPy array) with the same dimensions as the input frame. Each position in this matrix stores a relative depth value corresponding to the pixel in the image.
The depth map generated by MiDaS is a two-dimensional array that has the same dimensions as the input frame. Each element in this array stores a relative depth value corresponding to the pixel in the image. For example, for a frame with a resolution of 480 by 640 pixels, the depth map will also have 480 rows and 640 columns. Each value represents the relative depth of a specific pixel in the scene. It is important to note that these values do not correspond to absolute metric distances (meters or centimeters), but rather to a relative scale describing the scene geometry, which is useful for comparing the relative closeness or distance of different regions within the same frame.
Pixel-to-Meter Conversion
To correctly interpret movements in a video, it is necessary to convert distances from pixels to physical units like meters. Our system achieves this by calibrating a pixel-to-meter scale factor, combining information from human pose estimation and the depth map predicted by MiDaS.
The process works as follows: in each frame, YOLO Pose detects a person near the package and extracts visible joints (e.g., head, shoulders, hips, and ankles). From these keypoints, the person’s height in pixels is calculated and compared to a known reference height (e.g., 1.70 m). The ratio between these measurements provides the scale factor to convert pixels into meters.
To ensure that the calculated scale corresponds to the interaction with the package, the factor is only validated if the detected hand is within the package’s bounding box and at a depth similar to that reported by MiDaS. Once the interaction is confirmed, the factor is stored and applied to the movement of the package centroids, yielding distances in meters.
Action Recognition
The final step of our system is to integrate the previously described processes to perform action recognition. This task can be approached either through programmed rules or via models that identify movement patterns in sequences of spatial and temporal vectors.
In our case, the goal is to detect when an operator throws a package. To achieve this, the system evaluates the following conditions:
· Initial interaction: the operator picks up the package when the wrist coordinates are within—or very close to—the object’s bounding box.
· Depth verification: it is confirmed that the person and the package are on the same depth plane, ensuring spatial correspondence of the coordinates.
· Object movement: using the object’s tracked ID, changes in its position between consecutive frames are analyzed to determine if it is in motion.
· Package release: detected when the operator’s wrists or hands move away from the object’s bounding box.
· Throwing action: velocities and accelerations are calculated from the package centroids between frames. Thanks to the pixel-to-meter conversion, it is possible to define a physical threshold (in m/s²) to differentiate between acceptable handling and abrupt movements—such as throwing the package—which could cause damage to the package and its contents.
By combining object detection, pose estimation, tracking, depth mapping, and pixel-to-meter conversion, the system establishes a complete analytical pipeline—from raw video frames to structured, interpretable events. Each layer adds a piece of contextual understanding: what is happening, who is involved, where in space the action occurs, and how it evolves over time. Together, they form a foundation capable of transforming visual information into operational intelligence.
Computer vision is rapidly moving from research labs into operational environments, and use cases like this demonstrate its potential beyond automation—it becomes a new way of seeing how organizations actually work. In aviation, logistics, and many other industries, video is no longer just evidence of what happened but data to prevent it from happening again. The same principles applied here to detect mishandling could, with slight adaptation, monitor safety compliance, optimize workflows, or ensure quality control.
As machine learning models become more accurate and accessible, the real challenge shifts from building algorithms to integrating them meaningfully into everyday operations. That’s where the next frontier lies: bridging the gap between model outputs and business decisions to create systems that not only observe but continuously improve how we work.


